Product engineering · Pharma forecasting SaaS
PhorecastAI
A deterministic pharma revenue forecasting product that turns a complex spreadsheet model into a guided workflow producing forecasts, investment metrics, and investor-ready reports.
- Credit
- Pharma forecasting
- Role
- Freelance Product Engineer — lead and solo developer
- Status
- Live beta · launched February 2026, handed into the client's operation
- Stack
- ReactTypeScriptSupabase / PostgresRLSPostHogPlaywrightCloudflare PagesResend
Problem
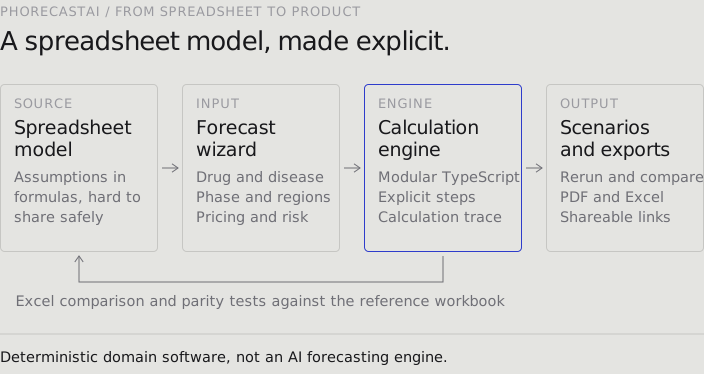
Pharma forecasting combines epidemiology, patient funnels, market share, pricing, adoption, development risk, financing, and dilution. The client's source process was an Excel-style model with assumptions buried in formulas and scenarios difficult to share safely. A useful product had to make the model easier to operate without hiding how the numbers were produced.
PhorecastAI turns that process into a guided web workflow for biotech founders and life-science investors: create a project and asset, move through a forecast wizard covering drug and disease details, development phase, regions, launch timing, benchmarks, pricing and dosing, financing, and risk — then inspect assumptions, rerun forecasts, compare scenarios, and export a report instead of passing spreadsheet versions around.
Role and ownership
Paid freelance engagement beginning September 2025. Starting from an existing product scaffold and requirements set, I was the lead and solo developer for the implementation and hardening work: the TypeScript calculation modules, the React workflow around them, Supabase persistence and reference data, the investment and dilution calculations, export and reporting paths, deployment, analytics, beta feedback capture, and the fixes driven by real tester input.
The shipped core is deterministic domain software, not an AI forecasting engine. AI-assisted defaults for new diseases or drug classes were discussed as future scope; they are not part of what shipped.
Engineering decisions
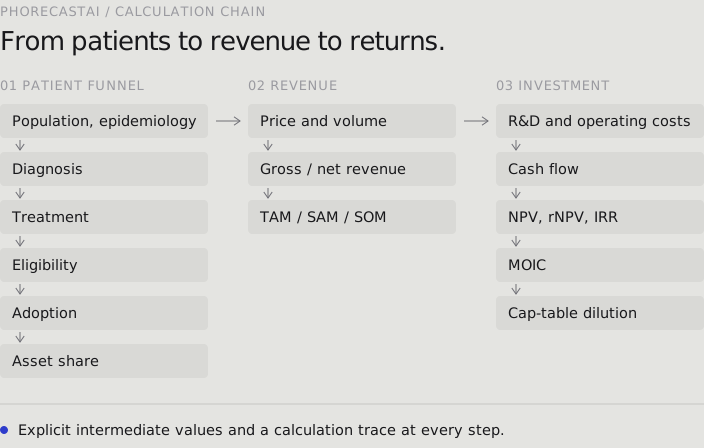
- Make the model explicit. Modular TypeScript calculations move from population and epidemiology through diagnosis, treatment, eligibility, adoption, and asset share to price and volume, gross/net revenue, TAM/SAM/SOM, R&D and operating costs, cash flow, NPV, risk-adjusted NPV, IRR, MOIC, and cap-table dilution — with explicit intermediate values and a calculation trace.
- Validate against the reference, not intuition. Workbook analysis, intermediate-value views, CLI diagnostics, parity constants, and Excel comparison tests made formula disagreements inspectable. The MOIC and cap-table work allocated operating costs by phase and year, implemented an equity solver for the circular investment relationship, and corrected a dilution formula — surfacing a pre-existing error in the reference workbook that was documented rather than copied into the product.
- Keep region semantics honest. Regional TAM/SAM resolves each region's price ratio before summing instead of applying one US list price to aggregate patient counts; gross-to-net, order-of-entry, compliance, adoption, and asset share stay in SOM/revenue logic rather than leaking into TAM/SAM.
- Treat reporting and support as product surfaces. PDF and Excel exports, shareable compressed report links, a TAM/SAM methodology page, PostHog instrumentation, and a contextual feedback path make the product observable after a forecast leaves the main screen.
Evidence and result
- An early CLI report generator ran the revenue portion but skipped the investment pipeline, producing PDFs with missing KPIs and charts. I rewrote it to mirror the full application runner — regional aggregation, R&D and operating costs, cash flow, NPV/rNPV/IRR, multi-stage valuation, MOIC, and cap table — keeping Playwright only for the browser-bound export step.
- A regional zero-value bug traced to two causes: region normalization and Supabase's default 1,000-row response limit silently truncating a 1,508-row benchmark table. The fix combined normalized region codes with paged fetching, then carried incidence and prevalence with correct units through the wizard, overrides, funnel, PDF, and Excel outputs.
- The beta launched on 3 February 2026. An April feedback sprint fixed signup confirmation and redirects, regional population loading, epidemiology display units, uptake defaults, data-source presentation, and indication naming — and shipped a Share of Category/Share of Disease view, a TAM/SAM methodology page, and shareable compressed PDF links.
- Phase 1 PostHog instrumentation covered signup, asset creation, forecast runs and reruns, parameter edits, scenarios, exports, and sharing, plus landing-page CTAs, PDF requests, demo video plays, and page views.
- A persistent in-app feedback control captures a message, optional pasted screenshot, and forecast context; a Cloudflare Pages Function writes an idempotent Supabase record, stores a private signed screenshot link, sends a structured Resend email, and emits a PostHog event.
Status and boundaries
PhorecastAI reached a working beta with a paid client and real tester feedback, deployed on Cloudflare Pages with Supabase auth, Postgres, row-level security, storage, and migrations. The evidence supports a working forecasting and reporting product — not production-scale traction or autonomous financial advice. Dataset expansion, eligibility modeling, and moving proprietary calculations behind server-side functions remained follow-on scope; PDF sharing stayed relatively slow because charts render at request time.